In my recent posts about the Model Context Protocol (MCP), I’ve introduced MCP Tools, a command-line interface for interacting with MCP servers. Today, I want to compare it with the official MCP Inspector to help you decide which tool best fits your workflow.
Understanding the Two Tools
Both tools serve as interfaces for Model Context Protocol servers, but they take different approaches and excel in different areas.
Official MCP Inspector
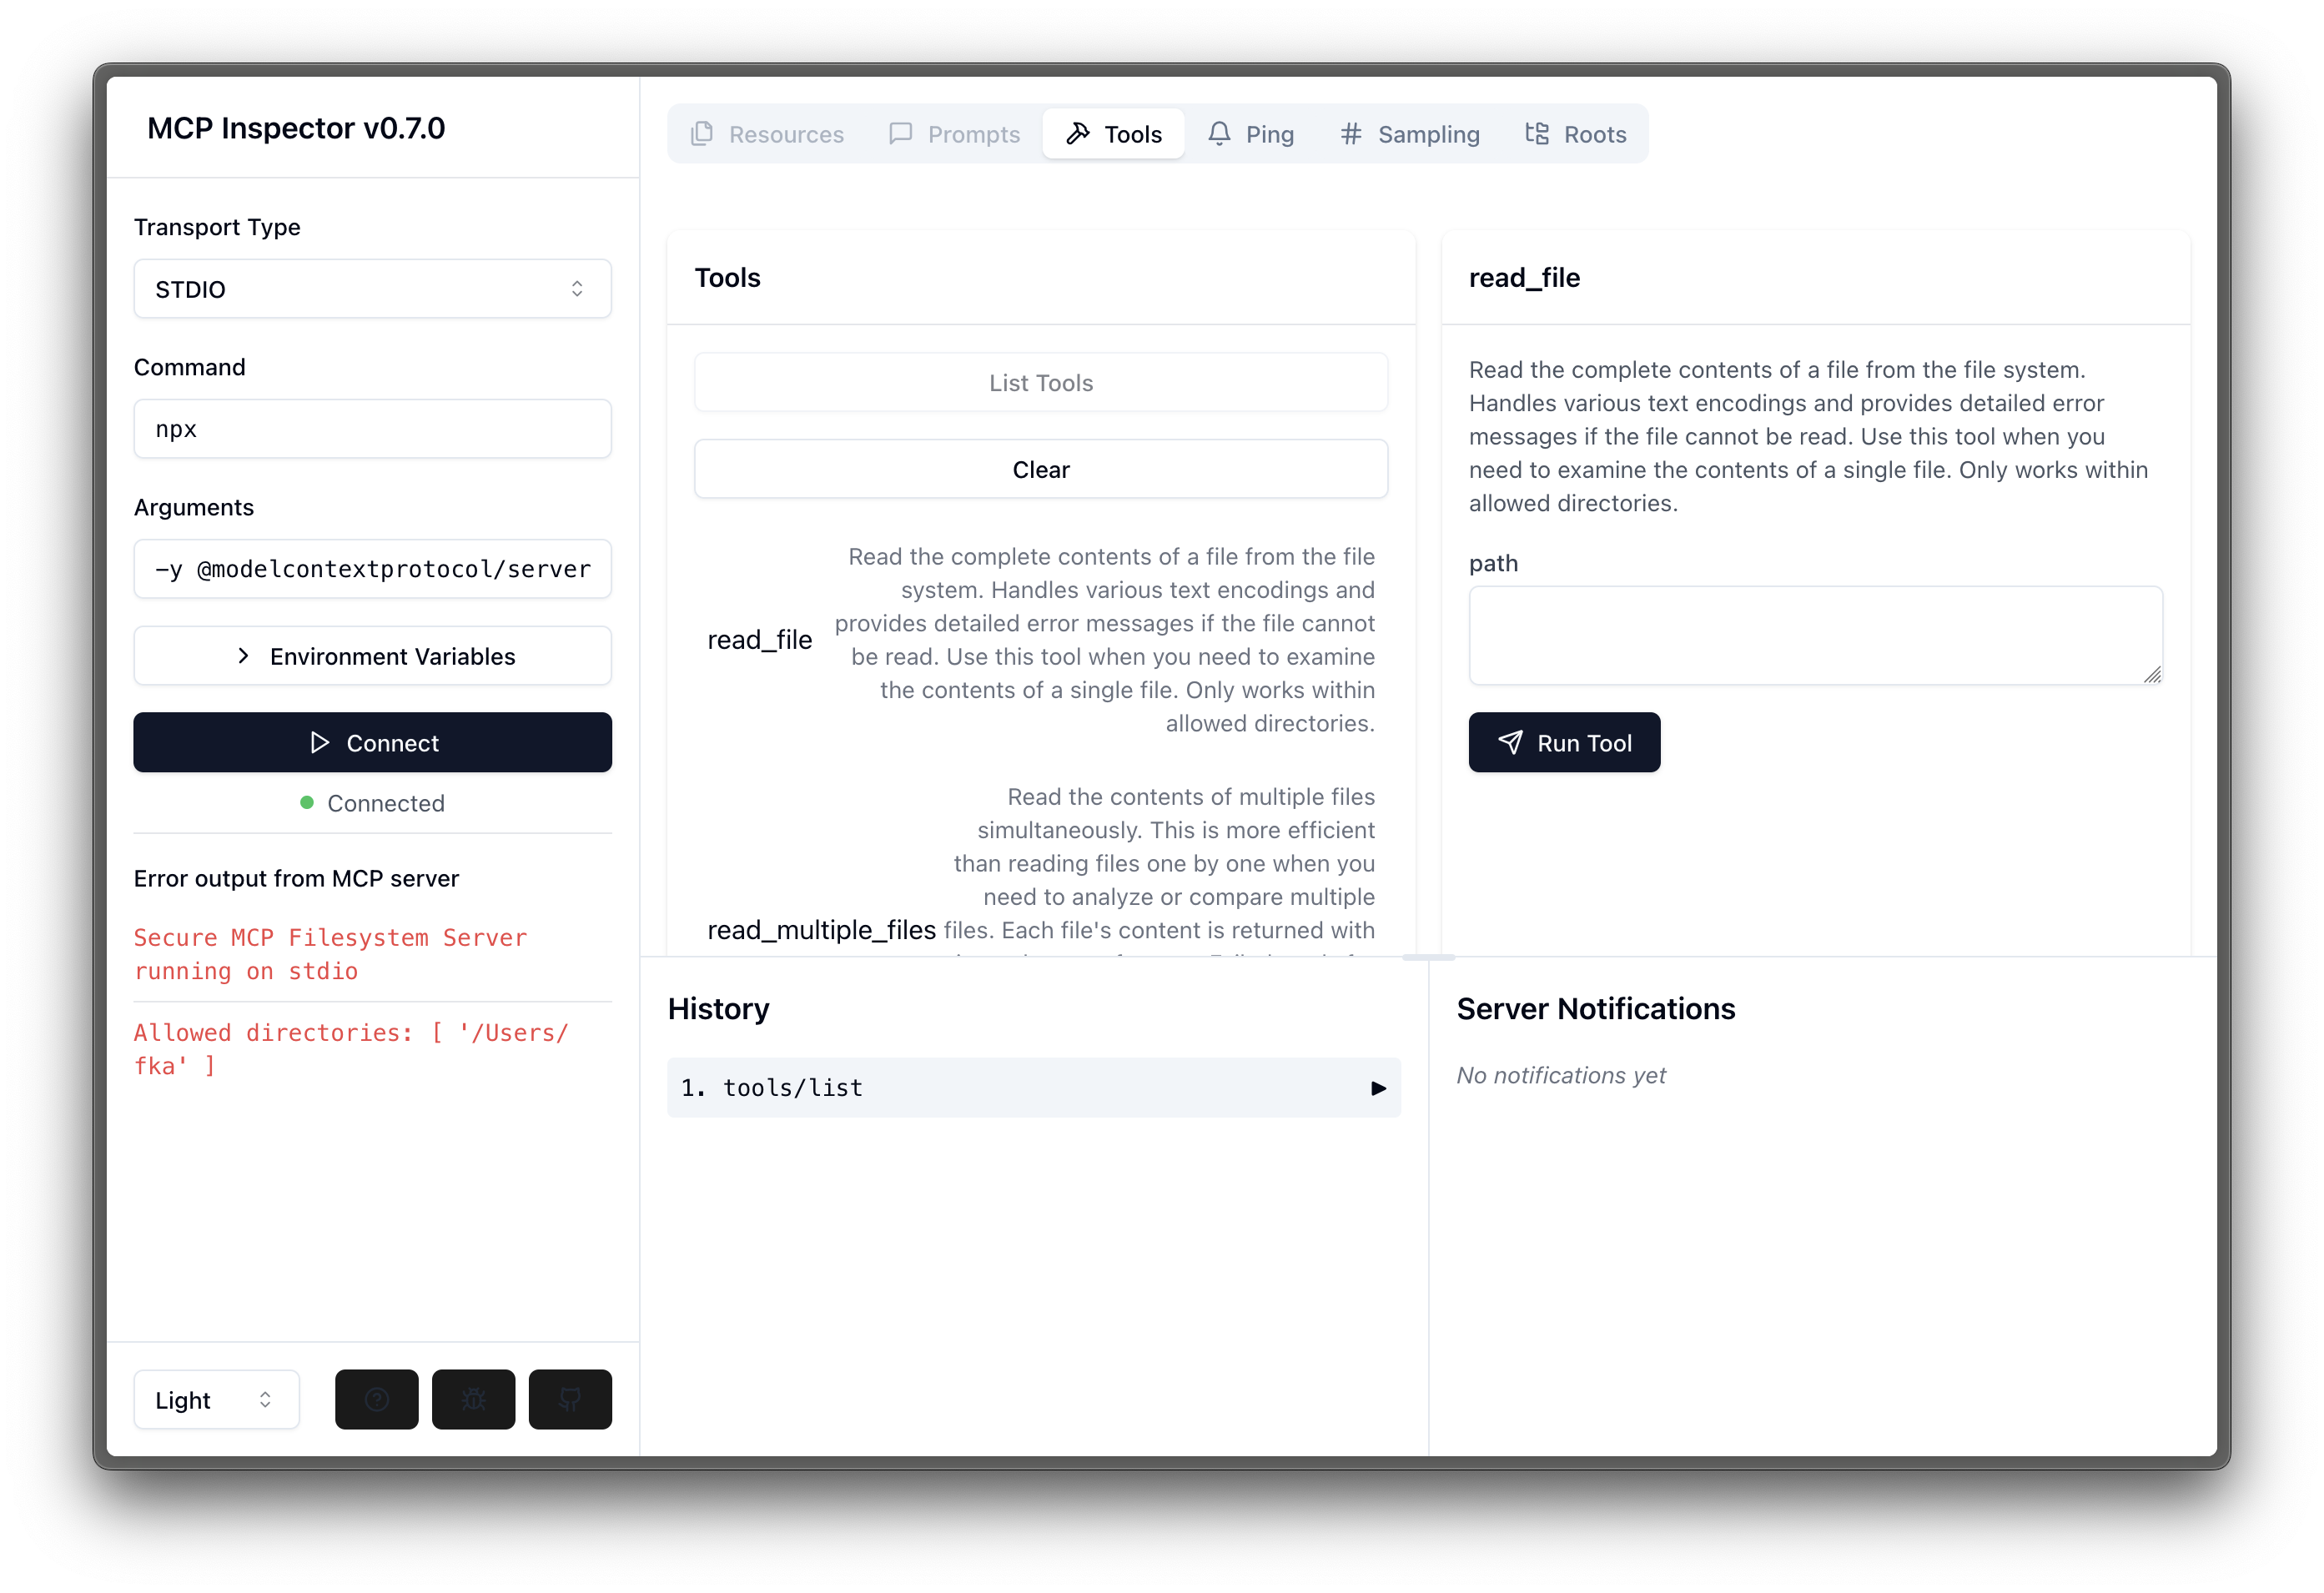
The official MCP Inspector is primarily a web-based interactive developer tool focused on testing and debugging MCP servers. It provides a GUI interface with:
- Server connection pane for transport selection
- Resources tab for inspecting available resources
- Prompts tab for testing prompt templates
- Tools tab for exploring and executing tools
- Notifications pane for logs and server messages
You can run it directly through npx without installation:
npx @modelcontextprotocol/inspector <server command>
MCP Tools
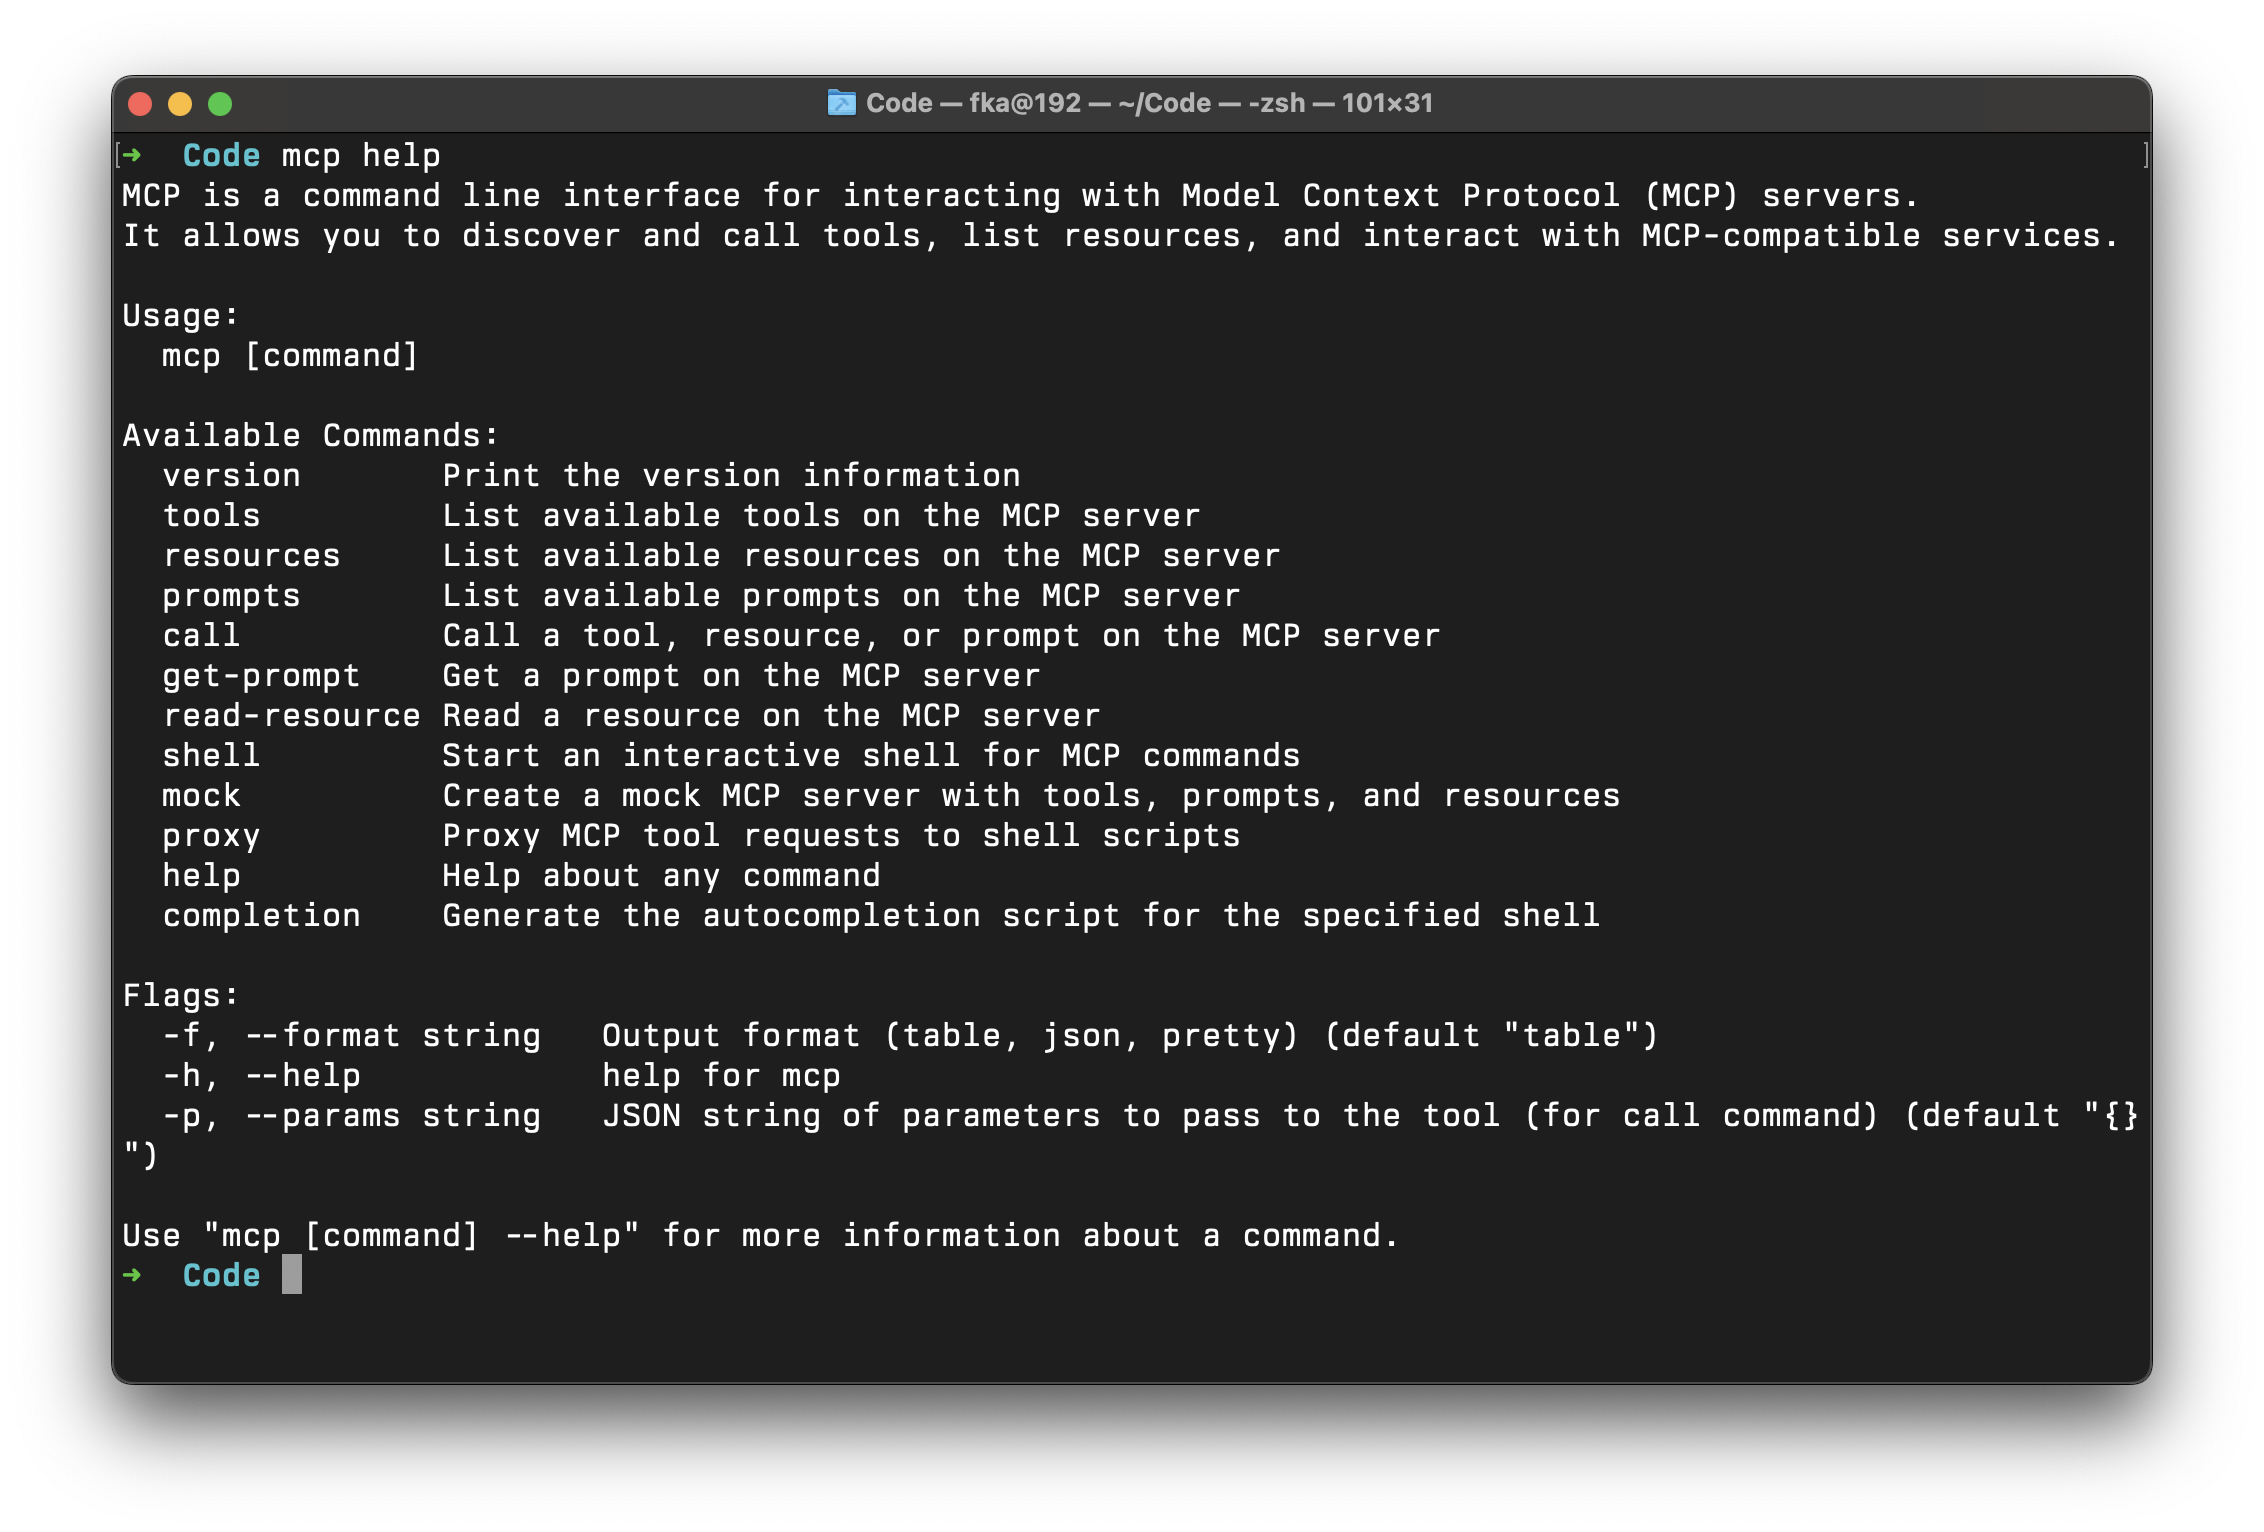
MCP Tools is a CLI-based alternative I’ve developed that emphasizes command-line workflows, automation, and extended functionality. Key differences include:
- Command-line interface for scripting and automation
- Native installation via Homebrew or from source
- Proxy mode for shell script integration
- Mock server capabilities for development and testing
- Interactive shell for persistent connections
- Flexible output formatting options
When to Choose MCP Tools Over Inspector
While the official MCP Inspector is excellent for visual debugging and exploration, MCP Tools offers several advantages in specific scenarios:
1. Proxy Mode: Shell Command Integration
The most powerful feature unique to MCP Tools is its proxy mode, which allows you to register shell scripts or inline commands as MCP tools:
# Register a shell script as an MCP tool
mcp proxy tool add_operation "Adds a and b" "a:int,b:int" ./add.sh

# You can also register inline commands directly
mcp proxy tool multiply "Multiplies a and b" "a:int,b:int" -e 'echo "Product of $a and $b is $(($a*$b))"'

# Register following command as your stdio MCP server.
mcp proxy start
This enables you to:
- Leverage existing shell scripts and commands as MCP tools
- Rapidly prototype new tools without building a full MCP server
- Create bridges between MCP clients and system utilities
When a client calls the tool, parameters are passed as environment variables to your script, and the output is returned as the tool response:
# Simple addition script (add.sh)
#!/bin/bash
result=$(($a + $b))
echo "The sum of $a and $b is $result"
The beauty of this proxy approach is that it’s language-agnostic. Since it’s just executing shell scripts, you can write your tool implementations in any language you prefer:
# Register a Node.js script as an MCP tool
mcp proxy tool count_letter "Counts occurrences of a letter in a word" "word:str,letter:str" ~/.mcpt/count_letter.js
Here’s how the Node.js implementation of ~/.mcpt/count_letter.js might look:
#!/usr/bin/env node
// count_letter.js
const word = process.env.word;
const letter = process.env.letter;

if (!word || !letter) {
  console.error("Missing required parameters 'word' or 'letter'");
  process.exit(1);
}

const count = (word.match(new RegExp(letter, 'g')) || []).length;
console.log(`The letter '${letter}' appears ${count} time(s) in '${word}'`);
Don’t forget to make the script executable:
chmod +x ~/.mcpt/count_letter.js
You can then call this tool with:
mcp call count_letter --params '{"word":"strawberry","letter":"r"}' mcp proxy start
# Output: The letter 'r' appears 2 time(s) in 'strawberry'
Let’s see on Claude Destkop app working:
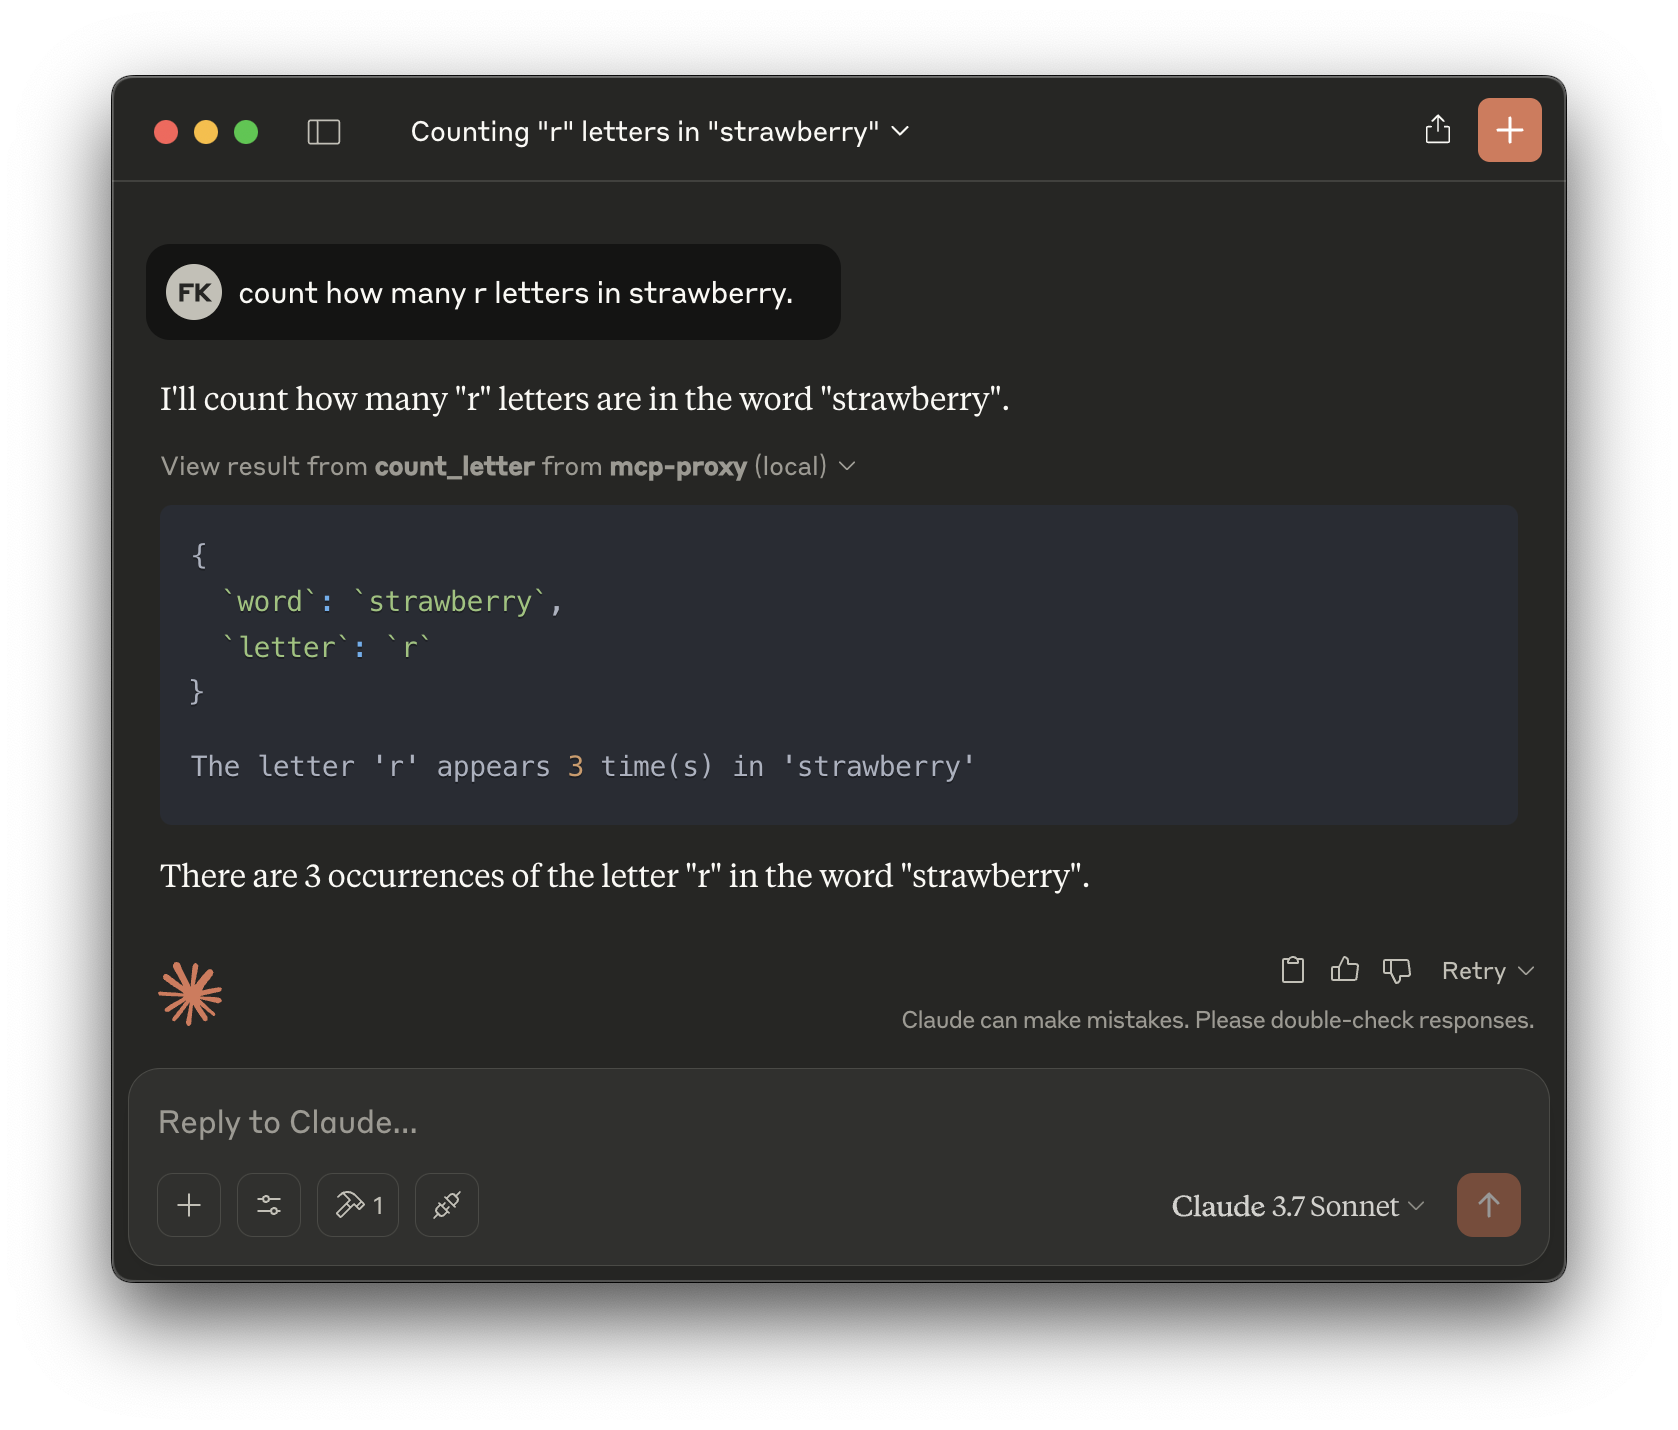
This proxy functionality is completely missing from the official Inspector and opens up powerful integration possibilities.
Proxy server configuration is being saved in ~/.mcpt/proxy_config.json as following:
{
  "add_operation": {
    "description": "Adds a and b",
    "parameters": "a:int,b:int",
    "command": "echo \"total is $a + $b = $(($a+$b))\"",
    "script": "" // /path/to/add.sh if not inline
  }
}
2. Mock Server Mode for Client Development
MCP Tools includes a mock server mode that’s invaluable when developing MCP clients:
# Create a mock server with a mock tool
mcp mock tool calculate "Calculates arithmetic operations"

# Creare a mock server with a mock resource
mcp mock resource data:my_data "Sample data" "Some content"

# Create a mock server with multiple mock entities
mcp mock tool     calculate     "Calculates arithmetic operations" \
         resource data:my_data  "Sample data" "Some content" \
         prompt   my_prompt     "Say hello" "Hello \{\{name\}\}"
This enables you to:
- Develop MCP clients before implementing the actual server
- Test client behavior with controlled responses
- Simulate various server scenarios
The mock server supports argument substitution in responses, detailed logging, and can be configured programmatically—features not available in the official Inspector.
One of the most valuable aspects of the mock server is that it logs all interactions to ~/.mcpt/logs/mock.log. This allows you to see exactly how your LLM is interacting with the mock server:
# Watch the log file in real-time
tail -f ~/.mcpt/logs/mock.log
These logs show you all the tool calls, parameters, and responses, giving you valuable insights into what your LLM application actually needs from your MCP server. This makes it much easier to implement the real server later, as you’ll have a clear record of the interaction patterns and required functionality.
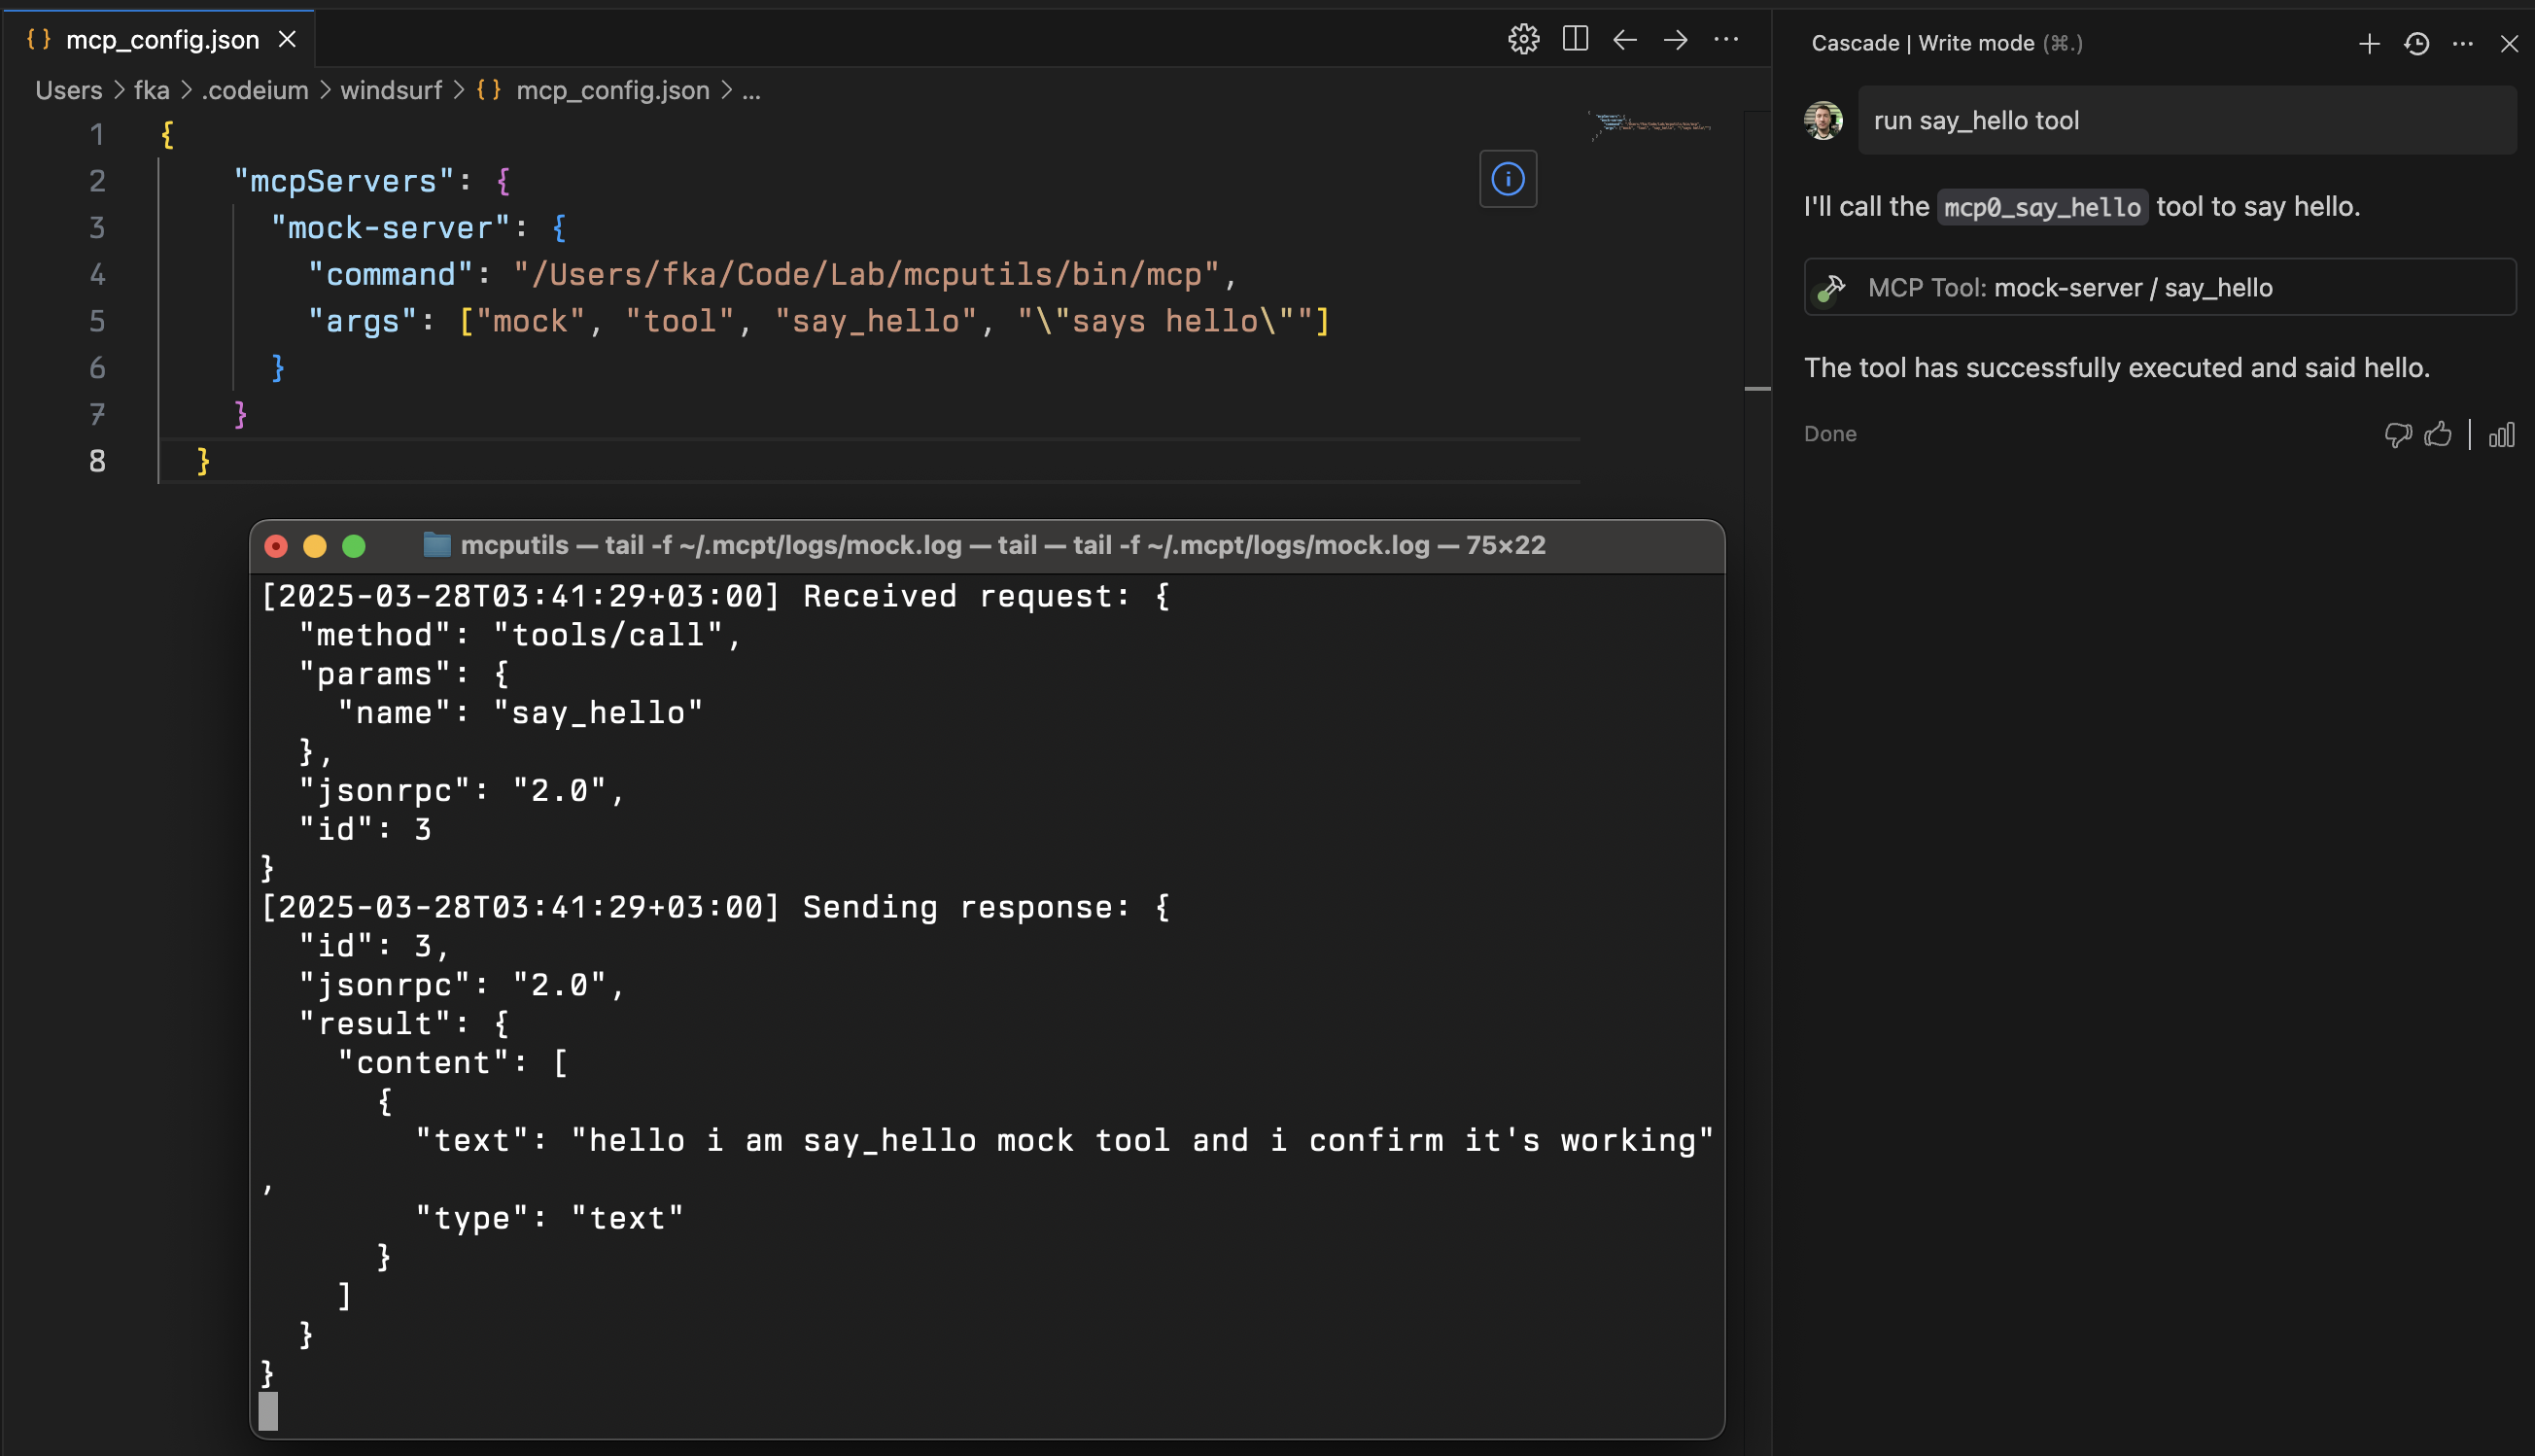
An example for MCP Server configuration JSON:
{
  "mcpServers": {
    "mcp-mocking": {
      "command": "mcp",
      "args": [
        "mock",
        "tool", "calculate", "Calculates arithmetic operations",
        "resource", "data:my_data", "Sample Data", "Content",
        "prompt", "my_prompt", "Say Hello", "Hello "
      ]
    }
  }
}
3. CLI-First Approach for Automation
MCP Tools excels in command-line workflows and automation scenarios:
# Script integration example
RESULT=$(mcp call read_file --params '{"path": "config.json"}' --format json npx -y @modelcontextprotocol/server-filesystem .)
# Process the result with jq or other tools
echo $RESULT | jq '.content'
The CLI approach makes it perfect for:
- CI/CD pipelines and automation scripts
- Server-side scenarios without GUI requirements
- System integration with other command-line tools
4. Output Format Flexibility
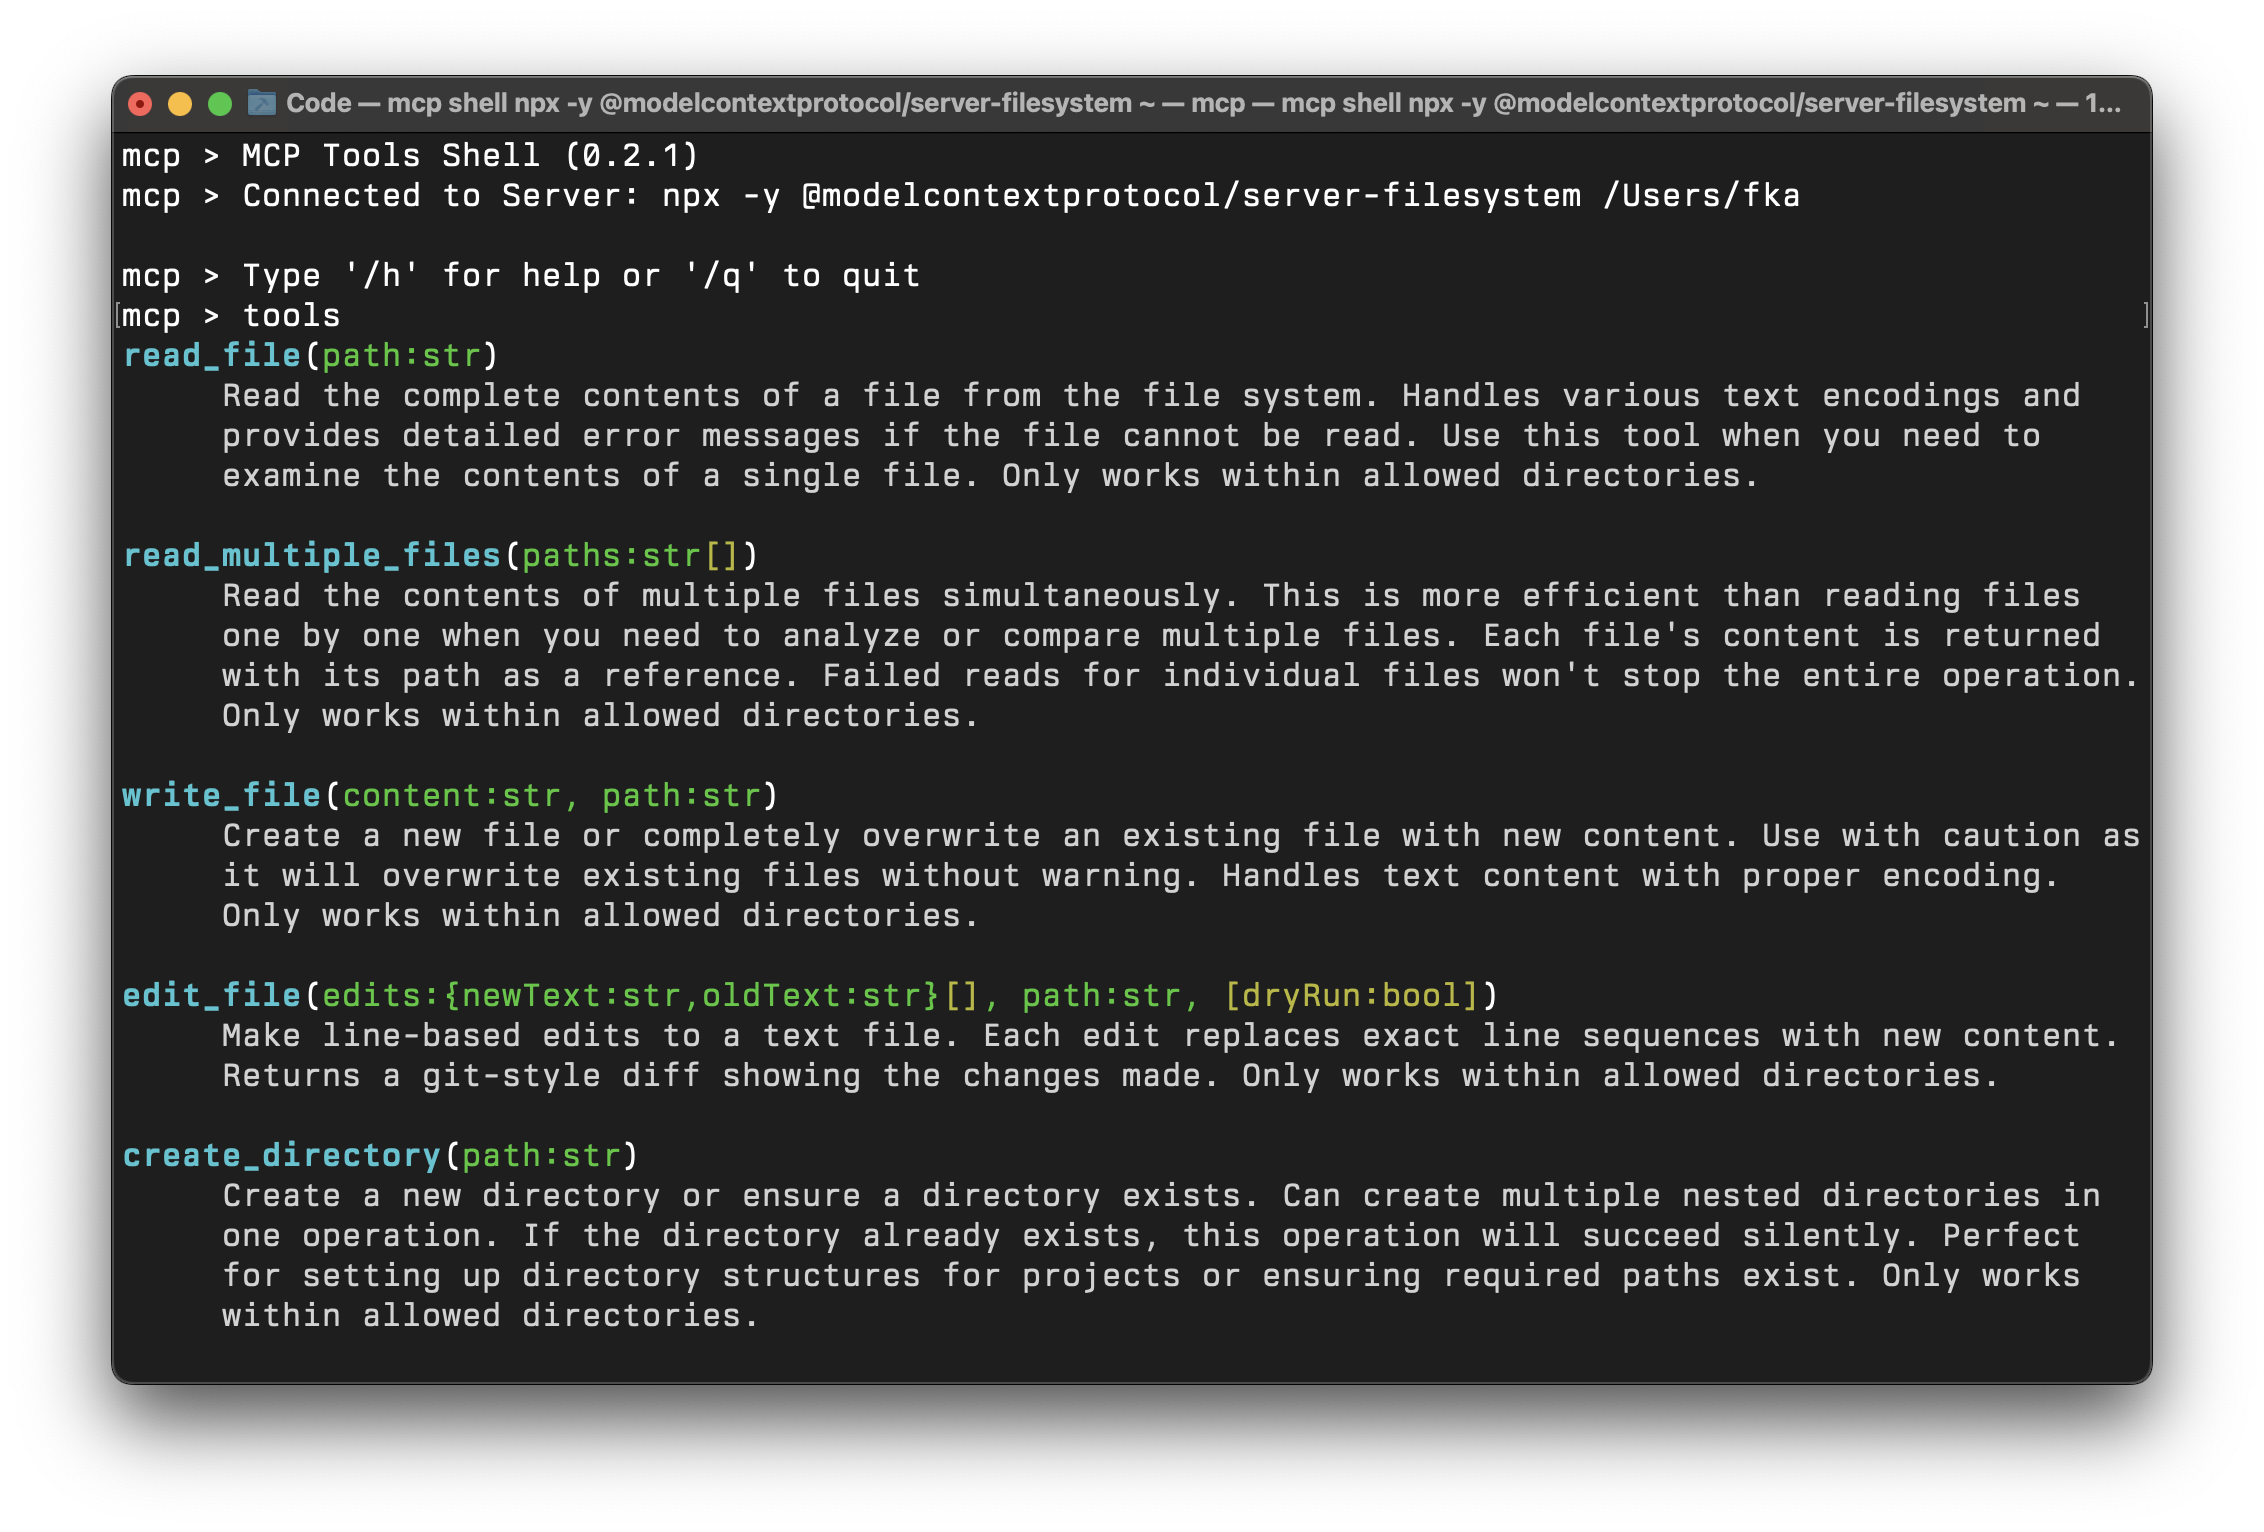
MCP Tools supports multiple output formats tailored to different needs:
# Table format (default) - human-readable
mcp tools npx -y @modelcontextprotocol/server-filesystem .

# JSON format - machine-readable
mcp tools --format json npx -y @modelcontextprotocol/server-filesystem .

# Pretty JSON format - debugging
mcp tools --format pretty npx -y @modelcontextprotocol/server-filesystem .
This flexibility makes it suitable for both interactive use and programmatic integration.
When to Stick with the Official Inspector
The official MCP Inspector still has its place in your toolkit:
- When you prefer a visual interface for exploration
- For detailed visual inspection of resource content
- For developers who are more comfortable with web interfaces than command lines
Real-World Example: Developing an LLM Application
Let’s consider a practical scenario where you’re developing an LLM application that uses MCP:
- Initial Development Phase:
- Use MCP Tools’ mock server to simulate tools your LLM will use:
mcp mock tool search_knowledge "Searches knowledge base" - Develop your LLM application against this mock server before implementing the actual knowledge base integration
- Use MCP Tools’ mock server to simulate tools your LLM will use:
- Integration Phase:
- Use MCP Tools’ proxy mode to create a bridge to your actual knowledge base:
mcp proxy tool search_knowledge "Searches knowledge base" "query:str" ./search_db.sh mcp proxy start # this is your STDIO server command - Your LLM application continues using the same MCP interface, but now connects to your real system and you’ll have a
search_knowledgetool withSearches knowledge basedescription.
- Use MCP Tools’ proxy mode to create a bridge to your actual knowledge base:
- Production Phase:
- Implement your full MCP server in your preferred language
- Use both MCP Inspector (for visual debugging) and MCP Tools (for CLI testing) during final QA
Conclusion
Both the official MCP Inspector and MCP Tools have their places in your development toolkit. If you need visual debugging and a graphical interface, the official Inspector is excellent. However, if you require CLI workflows, automation integration, proxy functionality, or mock servers, MCP Tools offers capabilities that extend beyond what the official Inspector provides.
I recommend using both tools based on your specific needs:
- MCP Inspector for visual exploration
- MCP Tools for CLI workflows, automation, proxying, and mock server development
Try MCP Tools today with:
brew tap f/mcptools
brew install mcp
Or install from source:
go install github.com/f/mcptools/cmd/mcptools@latest
Let me know in the comments how you’re using these tools in your MCP development workflow!
Contributions Welcome
MCP Tools is an open-source project, and contributions are always welcome! If you have ideas for new features, bug fixes, or improvements, here’s how you can contribute:
- Fork the repository on GitHub: github.com/f/mcptools
- Create a feature branch for your changes
- Submit a pull request with a clear description of your improvements
Some areas where contributions would be particularly valuable:
- Additional tool templates for common use cases
- Improved documentation and examples
- Performance optimizations
- Integration with other development tools and workflows
Whether you’re a seasoned Go developer or just getting started with MCP, your contributions can help make these tools even more useful for the community.
This article was proofread and edited with AI assistance.


